 We’ve all read about the sugar tax being applied to fizzy drinks, which is all well and good. However the tax is bollocks, if they were applying the sugar tax and using the money generated to offset healthier options that would be fine.
Instead the sugar tax just vanishes into the government coffers and is probably spent on more champagne at the government party conference instead.
Action on Sugar
Action on Sugar is a campaign group with the goal of reducing the countries sugar intake, they have a fair bit of pull with both producers and government bodies. They surveyed the most sugar filled drinks, and posted the results here… (and images below).
Are Coca Cola or Fanta the big bad sugar demons or were the sugar highs found elsewhere ?
I wasn’t quite expecting the result to be as it is. Action on Sugar investigated 131 popular hot drinks, and calculated the sugars contained within each of them according to the venue selling them.
The biggest were 99g, which is 3 times the amount contained in a can of coca cola (33g).
The top 20 drinks, with 45% (9) of them being from Starbucks, 40% (8) from Costa Coffee, 10% (2) from KFC and 5% (1) from Cafe Nero, only 1 of them had less than 50g of sugar, and that is only 0.7g less at 49.3g.
Sugar Tax Exempt
There are two bands of tax based on the total sugar contained in the drinks. Medium Sugar at 5 grams and over per 100 millilitres, and High Sugar at over 8 grams per 100 millilitres. The actual rate of taxation is expected to be between 18-24 pence per litre, up to about 50p per standard 2 litre bottle.
The problem is, these hot drinks won’t be subject to the sugar tax, they are exempt.
The biggest were the “Hot Mulled Fruit Venti” from Starbucks, which contains 14.5 grams per 100 millilitres, which is nearly 50% more than Coca Cola at 10g per 100ml, and nearly double the upper sugar tax limit. Yet still Starbucks and Costa Coffee remain exempt from the sugar tax.
A Better Idea

Lazytown – Magnus Scheving
One of my friends says we need to stop tampering with foods so much and return them back to a more natural state.
Magnus Scheving the man behind Lazy Town who is 52 years old, kind of agrees. He uses the example along the lines of you take a fish from the sea and eat it raw its 100% good, steam the fish its 80% good, batter it in breadcrumbs and fry it its 40% good, process the left overs, mash it up, and reform it into fish cakes, roll it in breadcrumbs, deep fry it, and its practically worthless.
The more you process something from its original state the less it becomes worth nutritionally speaking. Given the dude is over 50 and looking damned good, dude may just have a point.
I’m not entirely sure this is what my friend meant, since they were talking about processing foods breaking down natural properties then having to replace said properties and augment tastes with additives but the message is similar. I think my friends idea is an almost an impossible thing to change quickly.
Healthier Options WILL be Taxed
Surely it would be a better idea, if the Tax were calculated, and the supermarkets applied the discount to alternatives. So Diet Coke would be 50p cheaper per bottle and so on. Make it cheaper to eat and drink healthy options. Instead what is likely to happen instead is everything will just increase.
Full Sugar Coca Cola will go up, 50 pence per bottle and SHOCK HORROR, Diet Coke will also increase by the same amount to maintain parity.
How will sugar tax actually help anyone other than making people poorer by taking more tax… perhaps in another 10 yrs, we’ll say we need more tax on sugar drinks and we can increase diets drink another 50p along with healthier drinks?
Below is the results of the investigation by Action on Sugar.
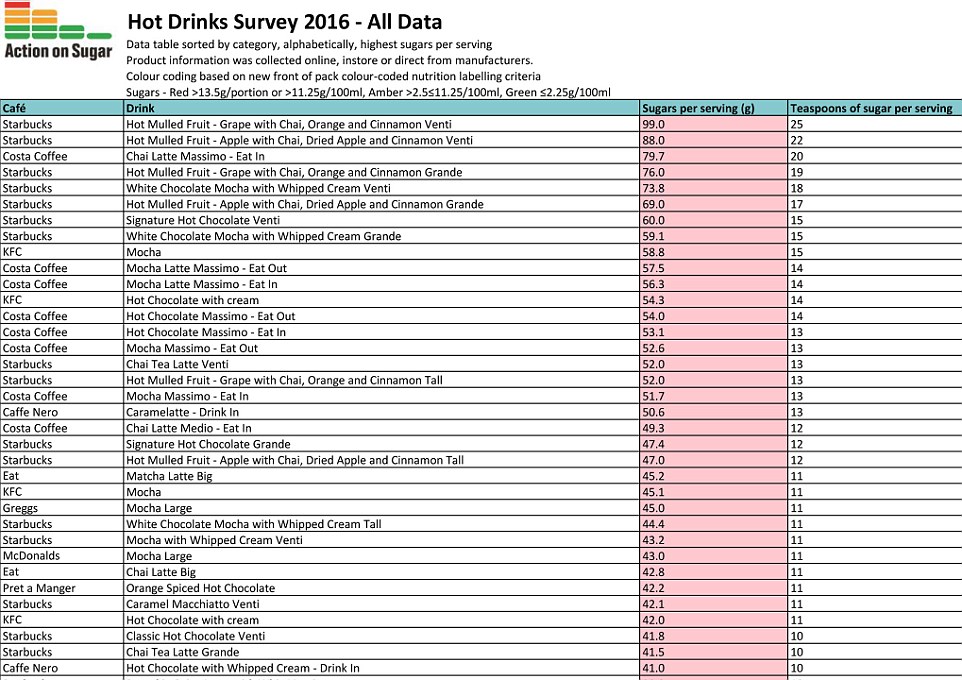
Action on Sugar High Sugar Hot Drinks

Action on Sugar High Sugar Hot Drinks

Action on Sugar High Sugar Hot Drinks
Caramel Coffee image by Razman Caliman, Sugar Charts by Action on Sugar, Lazytown Wallpaper Copyright LazyTown.


